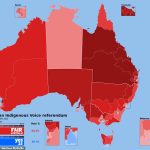
The outcome of the Indigenous Voice referendum in Australia was significantly influenced by various demographic factors. Data from the Australian Electoral Commission and predictions from Nine shed light on why the Yes campaign fell short.
Educational Attainment
The referendum’s results were closely linked to the educational background of voters. Constituencies with a higher percentage of voters holding bachelor’s degrees or advanced degrees displayed stronger support for the Yes vote. All electorates that voted in favor of the Voice were among the top third in the country in terms of educational attainment.
In contrast, areas with a lower number of degree holders were more inclined to vote against the Voice. For instance, South Australia’s Spence, where fewer than one in ten residents held a bachelor’s degree, saw a No vote of nearly 73 percent. Similar patterns emerged in other seats with low educational attainment, including SA’s Grey, Queensland’s Maranoa, and Victoria’s Mallee.
Income

Income levels also played a significant role in the referendum’s outcome. Wealthier constituencies, such as Curtin in Western Australia, Kooyong in Victoria, Wentworth in New South Wales, and Ryan in Queensland, predominantly supported the Voice. For instance, Grayndler, represented by Prime Minister Anthony Albanese, had a high median weekly household income and returned the second-highest Yes vote in the country at 74 percent.
On the other hand, electorates with lower incomes, particularly outside of capital cities, were less likely to support the Voice. Seats like Maranoa, NSW’s Parkes, Queensland’s Kennedy, and Victoria’s Mallee predominantly voted against the Voice.

Birthplace
Demographics also revealed a correlation between birthplace and referendum outcomes. Constituencies with a large percentage of Australian-born residents were more likely to vote against the Voice, with almost all such electorates opposing it. Riverina, centered on the NSW regional city of Wagga Wagga, where nearly 85 percent of residents are Australian-born, had a significant No vote of almost 72 percent.
Conversely, seats with a high proportion of overseas-born residents demonstrated more diverse voting patterns. Albanese’s Grayndler, with a substantial immigrant population, recorded the second-highest Yes vote among all electorates.
Language Spoken at Home
The language spoken at home also played a role in the referendum’s results. Among the 50 seats with the highest proportion of English speakers, only Newcastle voted in favor of the Voice. In contrast, the ten seats with the smallest percentage of English speakers all voted against it.
The Indigenous Voice referendum’s outcome in Australia was a complex interplay of education, income, birthplace, and language spoken at home, reflecting the diversity and dynamics of the nation’s demographics.